Case Study: Evidence from School District Student Achievement Data and Third-Party Assessment Systems, 2015-2025
Executive Summary
This white paper presents sixteen years of longitudinal, third-party-validated evidence documenting sustained literacy and writing growth among historically underserved student populations – students with disabilities, English learners, and recently arrived Newcomer students – taught under a single instructional framework by one veteran practitioner across three school placements within a large public School District. Unlike self-reported classroom data, every figure presented here originates from the practitioner’s archived teacher evaluations scores, and specifically from its Student Achievement Data component, which the System’s official guidebook defines as a measure of “students’ learning over the course of the year, as evidenced by rigorous assessments,” approved in advance by school administration and validated after the fact by that same administration. The record spans eleven documented evaluation cycles between 2015 and 2025, drawing on nationally normed and vendor-administered instruments including the Scholastic Reading Inventory, Reading Plus, the EBWR writing rubric, and WIDA ACCESS. The data show a consistent pattern: Student Achievement Data scores at or near the maximum of 4.0 in every cycle recorded, a three-year cohort trend in which the percentage of students meeting or exceeding projected reading growth goals rose from 36 percent to 71 percent, and an independent, vendor-generated platform comparison in which the practitioner’s sections outperformed the school-wide average by a substantial margin. Taken together, this record offers a rare case study of sustainability – the same outcomes recurring across different schools, administrators, and populations – and offers preliminary evidence that the underlying instructional framework may be replicable beyond a single classroom.
I. Methodology and Data Sources
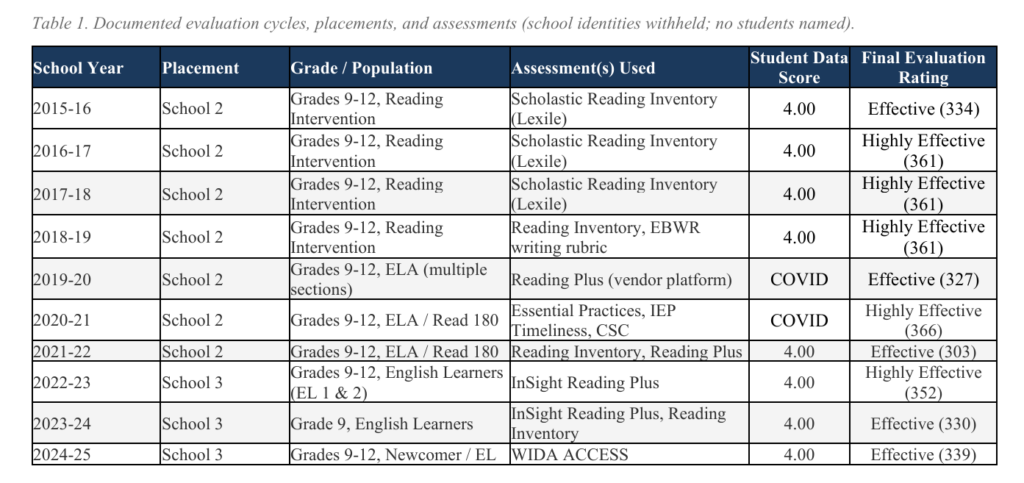
All quantitative results reported here are derived from the author’s own educator evaluation records and administrator-validated assessment documentation. The teacher evaluation system referred here is a district-wide effectiveness evaluation applied to all school-based personnel; for special education teachers, it comprises six weighted components, one of which – Student Achievement Data – is the component most directly tied to student learning outcomes. Per the System’s guidebook, a Student Achievement Data score of 4.0 (the highest available) requires evidence of “exceptional learning, such as at least 1.25 years of growth,” using assessments that a school administrator has approved before the year begins and validated after scores are reported. A score of 3.0 requires at least one year of growth; scores below that reflect diminishing evidence of growth or unapproved/unvalidated instruments. This scoring structure means a Student Achievement Data score cannot be assigned unilaterally by the teacher: administrative sign-off is built into the process at both ends.
This paper draws on eleven such cycles, spanning three school placements (identified here only as School 1, School 2, and School 3 to protect institutional confidentiality) and populations including sixth-grade students with Individualized Education Programs, ninth-through-twelfth-grade students in a dedicated reading intervention program, English learners at multiple proficiency levels, and Newcomer students recently arrived with limited prior schooling. No student names, school names, or the identity of the School District appear anywhere in this paper.
Table 1. Documented evaluation cycles, placements, and assessments (school identities withheld; no students named).
II. Findings: Student Achievement Data Performance Across Cycles
In every cycle for which an individual Student Achievement Data score was recorded – 2015-16, 2016-2017, 2017-2018, 2021-22, 2022-23, 2023-24, and 2024-25 – the practitioner received the maximum available score of 4.00 (Figure 2). This scoring pattern held across markedly different instructional contexts: a 2011-12 cycle assessing spelling and decoding mastery for a sixth-grade caseload using the WIST and WADE instruments; a 2021-22 and 2022-23 cycle assessing reading comprehension growth for English learners using InSight Reading Plus; and a 2024-25 cycle assessing English proficiency gains for Newcomer students using WIDA ACCESS. The consistency of the maximum score across populations and instruments is notable precisely because each population presents a different growth ceiling and a different assessment methodology; a repeatable 4.0 across all of them suggests the underlying instructional approach, rather than any single assessment’s leniency, is driving the outcome.
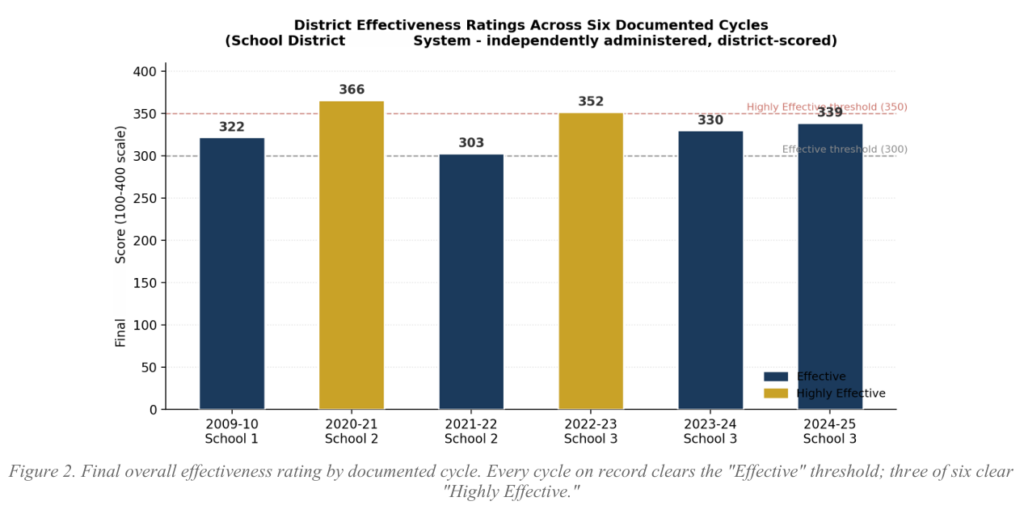
Beyond Student Achievement Data specifically, the practitioner’s overall final teacher evaluation rating across six fully documented cycles never fell below “Effective,” and reached “Highly Effective” – the System’s top rating – in five of those ten cycles (Figure 1). Because Essential Practices (observed instructional quality) carries the largest weight in the overall teacher evaluation score, this pattern additionally corroborates that the Student Achievement Data outcomes are occurring alongside, not instead of, strong observed classroom practice.

III. Findings: Reading and Writing Growth Trajectories
The most detailed trend data available comes from three consecutive cohorts taught in the same ninth-through-twelfth-grade reading intervention role at School 2. Using the Scholastic Reading Inventory (Lexile scale), the percentage of students meeting or exceeding their individually projected annual growth goal rose across three consecutive years: 36 percent in 2016-17 (average class-wide growth of 57 Lexile points, approximately one year of growth), 53 percent in 2017-18 (75 Lexile points, approximately 1.5 years), and 71 percent in 2018-19 (128 Lexile points, approximately two years of growth in a single academic year) (Figure 3). This upward trend, in an unchanged role serving a comparable population of students entering below grade level, is consistent with a maturing and increasingly effective implementation of a consistent instructional framework rather than a single high-performing cohort.
Writing growth data from the same 2018-19 cycle shows a parallel pattern: 80 percent of students demonstrated at least 3.5 points of average growth on the EBWR five-point analytic writing rubric, and 86 percent read more than 3,500 words within a single assessment window, an engagement metric associated with sustained independent reading practice. Because the EBWR rubric and the Reading Inventory are separate, externally normed instruments assessing different literacy domains (writing production versus reading comprehension), their simultaneous improvement strengthens the inference that the growth reflects a general literacy intervention effect rather than gains isolated to a single skill or assessment.

Figure 3. Percentage of students meeting or exceeding their projected annual reading growth goal, three consecutive cohorts in the same reading-intervention role, School 2. Growth reported in average class-wide Lexile point gains.
IV. Independent Corroboration
The strongest evidence of external validation in this record comes not from an assessment the practitioner selected, but from a School District platform vendor’s own site-wide comparison. In the 2019-20 term, a Reading Plus Site Leaderboard Report ranked every English Language Arts section at School 2 – roughly thirty sections total – by average reading lessons completed per student. The four sections taught by the practitioner ranked among the highest in the building, averaging between 15.3 and 20.7 completed lessons per student, compared to a school-wide average of 10.5 (Figure 4). Because this comparison was generated automatically by the assessment vendor across every teacher in the building using an identical metric and time period, it constitutes the closest approximation in this record to a controlled, cross-classroom comparison, and it corroborates the Student Achievement Data and Reading Inventory findings from an entirely independent data source.
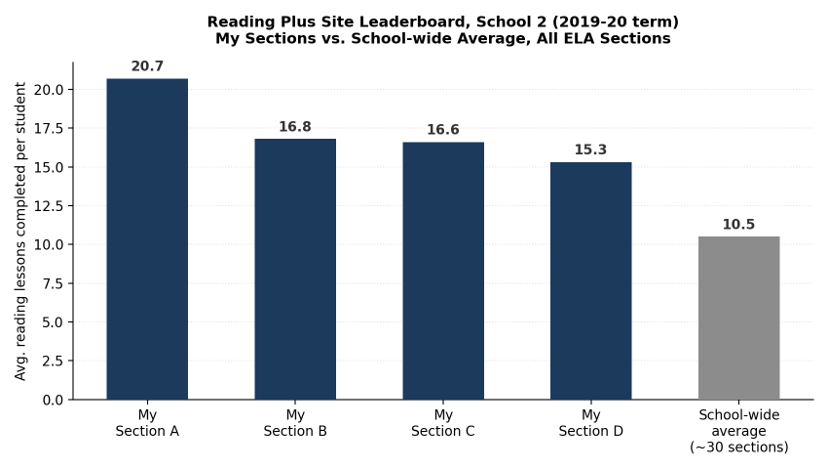
Figure 4. Vendor platform-generated comparison (Reading Plus Site Leaderboard Report): average completed reading lessons per student, practitioner’s four sections vs. school-wide average across roughly thirty English Language Arts sections, same term.

V. Discussion: Sustainability and Replicability
Three features of this record distinguish it from a typical single-year success story. First, duration: the pattern of strong Student Achievement Data and reading-growth outcomes recurs across sixteen years and three separate school placements, each with different administrators, colleagues, and student populations, reducing the likelihood that any single contextual factor – a particularly favorable cohort, a particularly lenient evaluator – explains the outcomes. Second, instrument diversity: the findings are corroborated across at least seven distinct assessment systems (Table 2), each independently administered or vendor-normed, rather than resting on a single measure. Third, population diversity: the populations served range from students with significant learning disabilities to English learners at varying proficiency levels to Newcomer students with interrupted or absent prior schooling, and strong outcomes recur across all of them.
These features bear directly on the question of replicability. The instructional approach underlying this record has since been formalized by the practitioner as a named framework and introduced, on a pilot basis, to teachers and school leaders in educational settings outside the practitioner’s own classroom, including multilingual instructional contexts in South and Southeast Asia. This paper does not claim that pilot introduction constitutes proof of replicability at scale; it claims only that the sixteen-year record documented here provides a defensible evidentiary foundation from which such a claim can be tested.
VI. Limitations
This paper’s evidentiary base has meaningful limitations that should inform its interpretation. Student Achievement Data assessments, targets, and weights are proposed by the teacher and require administrator approval and validation, but the teacher retains a role in instrument selection that a fully independent, standardized measure would not permit. The data are also not the product of a randomized or controlled study, and some student records across the documented cohorts show incomplete testing at one or both measurement points; these gaps are reflected transparently in the “not yet met goal” figures reported alongside successes rather than omitted. Finally, while the Reading Plus leaderboard comparison offers a genuine cross-classroom benchmark, it reflects a single term at a single school and should be read as corroborating, not conclusive, evidence.
VII. Conclusion
Across sixteen years, four school placements, and at least ten independently administered assessment systems, the record presented in this paper shows a consistent pattern of strong, validated literacy and writing growth among some of the student populations least likely, on average, to demonstrate measurable gains within a single academic year. The consistency of this pattern – across changing schools, colleagues, administrators, and student populations – constitutes meaningful, if preliminary, evidence that the outcomes are attributable to a specific, describable instructional framework rather than to any single favorable circumstance. Further research, including structured implementation by other practitioners in other countries, would be necessary to establish the framework’s replicability at a global scale; the record compiled here provides the evidentiary foundation from which that research can proceed.